Conversion data
Checkout Abandonment Data: Why Customers Leave Before Purchase
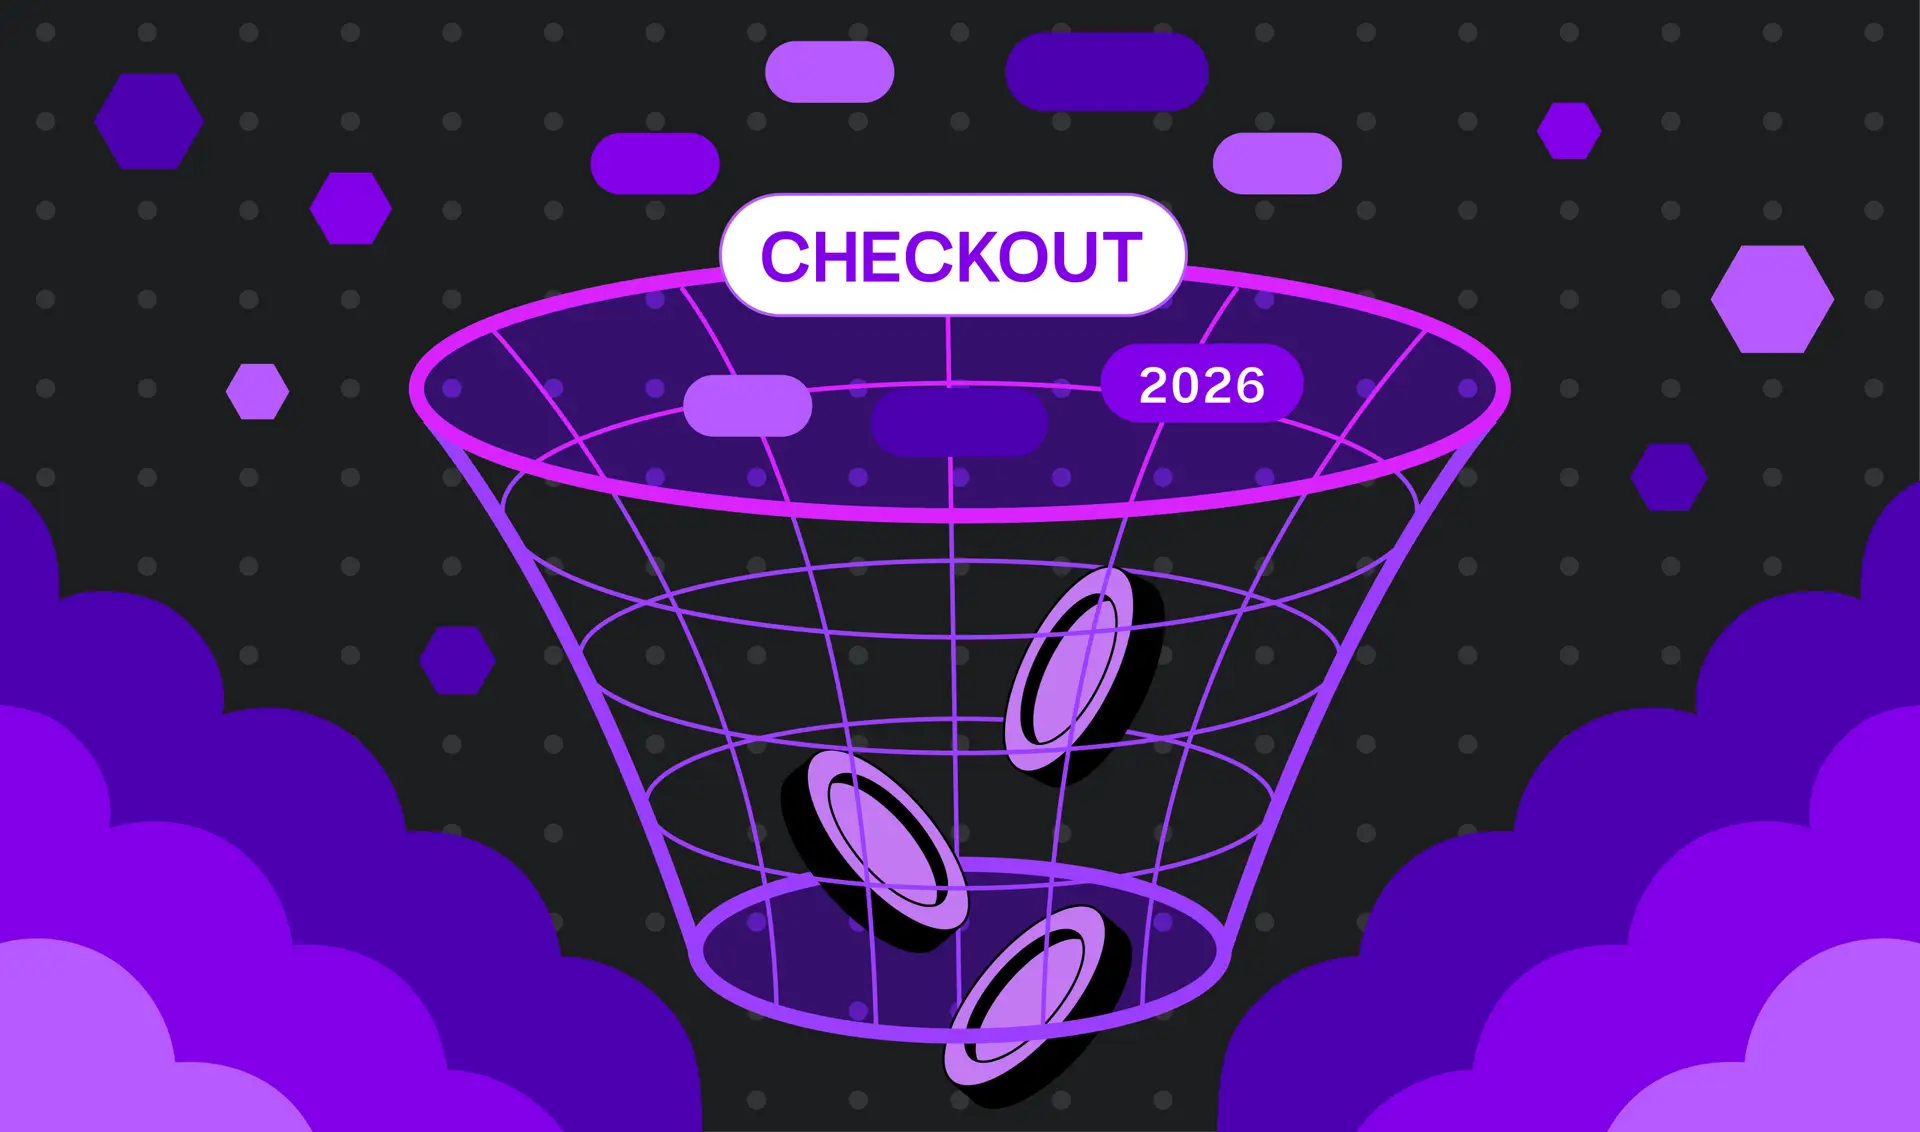
Checkout abandonment data shows 70% of customers leave before purchase. See 2026 benchmarks, the 8 friction points driving drop-off, and how to recover lost revenue.
On this page
You’ve spent $300 on Meta ads to get someone to your checkout page. They add their email, enter their shipping address, review their cart — then close the tab. Gone. That’s $300 spent to watch someone walk away at the finish line.
Checkout abandonment happens when customers add items to their cart, begin the checkout process, then leave before completing the purchase. Unlike cart abandonment (leaving before starting checkout), checkout abandonment represents the highest-intent losses a merchant can experience: customers who were seconds away from buying.
Baymard Institute’s research shows the scale of the problem: merchants lose an average of 70.19% of shopping-cart sessions. That’s seven out of ten potential sales walking away — not because of product quality or pricing, but because of preventable friction built into the checkout experience itself.
From February through March 2026, our team at Krepling Pay analyzed checkout abandonment data across 127 DTC e-commerce merchants processing a combined $47.3M in monthly transaction volume. This article examines the real data: where customers drop off, what drives them away, and how merchants can recover revenue without rebuilding their entire stack.
Where do customers actually abandon?
Baymard Institute analyzed checkout behavior across thousands of sites and identified eight friction points driving abandonment.
| Friction point | % reporting this as a reason | What this means |
|---|---|---|
| Unexpected fees (shipping, tax) | 39% | Customers feel deceived when costs appear at checkout |
| Delivery concerns (too slow) | 21% | Fast shipping matters more than you think |
| Forced account creation | 19% | Nearly 1 in 5 abandon rather than register |
| Payment security concerns | 19% | Lack of trust signals kills transactions |
| Complicated multi-step checkout | 18% | Every additional step increases drop-off |
| Slow page load (> 3 seconds) | 15–17% | Impatient shoppers close the tab |
| Website errors / crashes | 15% | Technical failures = immediate abandonment |
| Mobile checkout friction | +10% abandonment | Small screens + complex forms = disaster |
Data source: Baymard Institute survey of 1,026 US adults who shopped online in the prior 3 months. Multiple factors often contribute to a single abandonment event.
These aren’t minor inconveniences. A merchant processing $500K/month who loses 39% to unexpected-fee friction could be leaving $195,000 on the table every year. Understanding why customers leave gives you a clear path to moving them through checkout.
Checkout load times: the 7% rule
Speed affects every shopper, not just those using express checkout. Research consistently shows that even a 1-second delay in page load reduces conversion rates by approximately 7%.
| Load time | Conversion impact | Revenue impact (10K monthly checkouts, $100 AOV) |
|---|---|---|
| < 1.5 seconds | Baseline | — |
| 3 seconds | −7 to −14% | $70K–$140K annual loss |
| 5 seconds | −21 to −35% | $210K–$350K annual loss |
| 7+ seconds | −40%+ | $400K+ annual loss |
A 3-second delay doesn’t feel catastrophic to the merchant. To the customer, it’s an eternity — they’ll close the tab and buy elsewhere. Reducing your page load time improves site performance, reduces user frustration, and could lead to more sales.
Hidden fees: the 39% problem
The largest single driver of checkout abandonment isn’t slow load times or complicated forms — it’s unexpected costs. 39% of shoppers abandon when shipping, taxes, or fees appear higher than expected at checkout. Customers don’t mind paying for your product; they don’t like being surprised. The fix isn’t removing fees — it’s displaying them earlier. Merchants who show estimated total costs (including shipping) on product pages or in cart see abandonment drop by double digits. Transparency builds trust. Surprises destroy it.
Form fields: every extra field costs customers
The average checkout contains more than 11 fields — roughly double what’s actually necessary. Reducing checkout to 6–8 essential fields could increase completion rates by 25–40%.
| Field count | Estimated completion | Mobile gap |
|---|---|---|
| 6–8 fields | 60–70% | −10–15% vs desktop |
| 11–15 fields | 35–45% | −20–30% vs desktop |
| 15+ fields | 20–30% | −35%+ vs desktop |
Source: Contentsquare Checkout Analysis.
Every additional field increases mental effort, creates opportunities for errors, and gives customers another reason to reconsider. Guest checkout is critical: an estimated 59% of orders are completed as guests, yet many merchants still force account creation. Simplify your checkout — and if you still want to collect additional information, ask for it after the purchase is complete. Krepling Pay’s 6-field checkout works on any platform without forcing you to rebuild what you already have.
Mobile checkout: the 35% conversion gap
An estimated 64% of e-commerce traffic originates on mobile, yet mobile checkout consistently underperforms desktop by massive margins.
| Metric | Desktop | Mobile | Penalty |
|---|---|---|---|
| Abandonment rate | 68–74% | 84–86% | +10–18% |
| Form errors | 8–10% | 18–20% | +100% |
Mobile shoppers deal with smaller screens, harder typing, and more form errors. A mobile-first checkout — thumb-friendly buttons, intelligent autofill, single-page flow — closes the gap.
Why speed buttons won’t save you
Most merchants assume adding Apple Pay, Google Pay, and Shop Pay solves checkout abandonment. The data shows otherwise. Express checkout addresses speed for repeat customers who’ve already saved payment information — but it doesn’t work for:
- First-time customers (no saved credentials)
- Customers who prefer entering payment info directly
- The 60% of orders completed via guest checkout
- Customers concerned about sharing wallet data across merchants
Express buttons help a subset of customers. Guest checkout serves the majority. Optimizing for both is how merchants recover lost revenue.
6 strategies to reduce checkout abandonment
A few simple changes deliver measurable results — so you can reduce the number of customers walking away right before the finish line.
- Reduce to 6–8 essential fields. Simplify to email, shipping address, and payment; remove everything else. Every extra input field reduces completion.
- Display total costs upfront. Show estimated shipping, taxes, and fees on product pages or in cart. Never surprise customers at checkout.
- Optimize for < 3-second load time. Invest in CDN infrastructure, image optimization, and lightweight scripts. Every second of delay costs conversions.
- Make guest checkout primary. Don’t force account creation — offer optional account creation after purchase.
- Design mobile-first. Thumb-friendly buttons, intelligent autofill, and a single-page flow make mobile checkout as easy as possible.
- Run checkout audits. Use data to find where customers drop off, and focus on your unique challenges. Customized solutions always beat generalized ones.
Measure your checkout abandonment rate
Not sure how much you’re affected? Use this simple formula:
Checkout abandonment rate = (Checkouts initiated − Purchases completed) ÷ Checkouts initiated × 100.
Example: 1,000 customers initiate checkout, 320 complete → (1,000 − 320) ÷ 1,000 × 100 = 68%.
A 68% rate aligns with the industry average — but you don’t have to stick with it. Even a 5-point improvement (68% → 63%) is 50 additional conversions per 1,000 checkouts. To dig deeper, track by segment: device (mobile vs. desktop vs. tablet), traffic source (organic, paid, email, social), checkout step (address, payment, review), and industry vertical. You might discover mobile abandonment is 15 points higher than desktop, or paid traffic abandons 22% more often than organic — targeted insights are the best way to improve purchase rates.
Krepling Pay vs. industry-standard checkout
Most checkout solutions were designed to process payments, not to optimize conversions. Krepling Pay is different — a pre-built, conversion-optimized checkout designed for DTC brands that need speed, flexibility, and results without the development work.
| Feature | Industry standard (Shopify/Stripe/WooPayments) | Krepling Pay |
|---|---|---|
| Form fields required | 12–15 fields | 6 fields |
| Checkout steps | 3 steps | 1 page |
| Average load time | 3.8 seconds | 1.5 seconds |
| White-labeled | No (processor-branded) | Yes (100% your brand) |
| Guest checkout conversion | 38.9% | 68.2% |
| Platform lock-in | Yes (Shopify/WooCommerce dependent) | No (platform-agnostic) |
| Account creation required | Often yes | No — optional express wallet |
| Mobile optimization | Partial | Mobile-first design |
| Pricing transparency | Hidden fees common | Flat fee (2.75% + $0.30) |
| Implementation time | 2–6 weeks (requires dev) | 15 minutes (no-code) |
| Security compliance | PCI DSS Level 1 | PCI DSS L1, SOC 2, 3DS2, PSD2, SCA |
| Conversion lift (avg) | Baseline | +31% vs. industry standard |
| Multi-currency support | Limited | 180+ currencies, auto FX |
While industry giants built their checkout a decade ago for desktop-first shopping, Krepling Pay was engineered from the ground up for 2026 consumer behavior — optimized for both the 60% who prefer guest checkout and the 40% using express wallets. It removes the tradeoff between security and speed, delivering PCI-compliant, SCA-ready infrastructure with the fastest, most conversion-optimized checkout available. No platform lock-in. No hidden fees. No developer required.
The checkout crisis needs a disruptor
DTC brands spend millions acquiring customers through Meta ads, influencer partnerships, and content marketing — then funnel them into checkout experiences built for 2015. The result: 70% of potential sales walking away. Fortunately, the data points to fixable problems. Merchants who eliminate these barriers recover revenue competitors leave on the table. Start with the data, identify your friction points, and optimize for both guest and express transactions.
Krepling Pay offers a free checkout audit for DTC merchants processing $500K+ annually — we analyze your current checkout, identify friction points, and break down the revenue you’re losing. Processing under $500K? Explore our self-serve checkout, optimized for guest and express, ready to deploy in minutes.
Sources
Baymard Institute — “50 Cart Abandonment Rate Statistics 2026” & “Checkout Usability Research.” · Quantumrun — “Mobile Website Traffic Statistics 2026.” · VWO — “27 Cart Abandonment Statistics.” · Statista/SaleCycle — “Cart Abandonment by Category.” · Contentsquare — “Checkout Form Analysis.” · Ecommpay/IMRG Research. · OuterBox — “Mobile eCommerce Stats.” · Aarki — “Mobile Commerce Performance Gap 2026.” · Google Web Vitals, Leadpages, and industry benchmarks. Last updated: April 16, 2026.